
How we test home Wi-Fi, and what we can't measure
Every guide on this site starts from the same method. Here it is in full, including the parts that are estimates and the things an iPhone simply cannot see.
In short
- App Store apps can't read the Wi-Fi signal level (dBm) on an iPhone, so our app measures how the connection behaves: how fast the router answers, how steady that is, and how many requests go unanswered.
- Those three numbers become a score out of 100 for each spot; the colours between spots are an estimate.
- The method doesn't measure your internet speed, radio interference directly, or bands you aren't connected to.
- Screenshots in our guides use demo data and are always labelled as examples.
On this page
These guides are written by the team at TopCycle, an Italian company that makes WiFi Heatmap, an iPhone app for mapping home Wi-Fi. The app is how we look at a home before changing anything, so every guide follows the same logic. This page explains that logic, so you can judge our advice, and any other tool's results, for yourself.
Why there are no dBm on an iPhone
Most Wi-Fi advice talks about signal strength in dBm. On an Android phone or a Mac you can read that number directly. On an iPhone, only Apple's own AirPort Utility can show it, through its Wi-Fi scanner; our guides explain how to use it. Ordinary App Store apps, including ours, don't get the value: there is a system property that looks like it, but without a special Apple permission it returns a fixed number that never changes.
Our app checks for this while measuring and ignores the value unless it actually varies. Instead of the radio level, it measures something an app can observe honestly: how the connection behaves where you stand. That's close to what you feel anyway. Full bars and a frozen video call can happen in the same spot, and only the behaviour of the connection explains it. The signal level and the connection's behaviour answer different questions, and the guides use both.
What we measure in each spot
While you walk, the app opens short connections to your router and times them. Each spot gets a burst of three probes, and spots are at least 40 cm apart. From every burst we keep three numbers:
- Response time: the median time for a round trip to the router.
- Variation: how far the probes stray from that median. When a Wi-Fi link struggles, it retransmits data, and this number climbs before anything else does.
- Unanswered requests: probes that get no reply within 0.7 seconds.
A timeout only counts once the router has already answered on that connection. If the phone is offline, or local network permission is switched off, the spot isn't measured at all. That way a settings problem can't show up as a fake dead zone.
How the score out of 100 works
Each number is turned into a value between 0 and 1, and the three are averaged with these weights:
| Part of the score | Weight | Counts as best | Counts as worst |
|---|---|---|---|
| Response time | 58% | 5 ms | 120 ms |
| Variation | 25% | 0 ms | 40 ms |
| Unanswered requests | 17% | none | all |
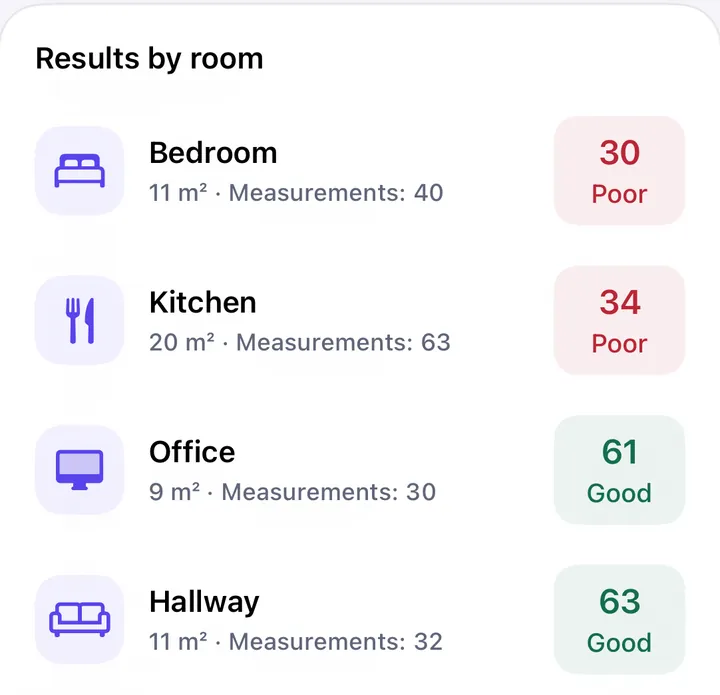
The result sets the label: 80 and above is excellent, 60 to 79 good, 40 to 59 fair, 20 to 39 poor, under 20 very poor. These thresholds are our own design choice, not an industry standard. They're tuned so that "excellent" means a video call won't notice anything and "poor" means it will.
How the colours between spots are filled in
The floor plan comes from ARKit, using the camera and motion sensors, so no LiDAR is needed. Position drifts by roughly 1 to 3% of the distance walked; the plan is then squared up, which absorbs most of that.
The colours between your measurements are an estimate, not a measurement. We use inverse distance weighting on a 20 cm grid: nearby readings count more than distant ones, up to 5 m away. Anywhere further than 2.5 m from a reading stays grey, because a guess that far out isn't worth showing.
The estimate doesn't know where your walls are. Between a reading in the living room and one in the bedroom it draws a smooth gradient, even if a concrete wall sits in between and the real change is a cliff. That's why every guide on this site tells you to measure on both sides of the wall you suspect.
What this method can't tell you
- Your internet speed. The probes stop at your router. A room can score excellent on a slow line.
- The radio itself. We see how the link behaves, which also depends on interference and on how busy the network is at that moment. We can't tell you which neighbour's network is on your channel.
- Bands and units you aren't connected to. The phone measures the band and the access point it's using. To compare 2.4 and 5 GHz, connect to each in turn and measure separately.
- Absolute comparisons between homes. Scores compare well within one home, on one phone, at one time of day. Treat a difference of a few points as noise.
About the screenshots in our guides
The app screens shown in our guides use demo data: invented floor plans and sample measurements, chosen to show what a typical problem looks like on a map. They are not surveys of real homes, and every caption says so. Your own numbers will be different.
Who we are
WiFi Heatmap and these guides are made by TopCycle, in Italy. There's no account in the app, and floor plans stay on your iPhone; the details are in the privacy policy. If something on this page, or in any guide, looks wrong to you, write to us at the address in the footer. We correct mistakes and update the date at the top when we do.